The Battle of Web Analytics Solutions in 2013

I’m loudly claiming that 2013 will be a great year for web analytics solutions! Actually, that’s my two cents on this market I’m monitoring on an everyday basis from both a selling and a practical perspective.

So why 2013 should be a great year? Each of the top 4 web analytics solutions in North America (1) Google Analytics, (2) Adobe Analytics (ex-Adobe SiteCatalyst), (3) IBM Digital Analytics (ex-IBM Coremetrics) and (4) WebTrends, should all launch new features and it looks like it will be a battle of Titans. Furthermore, web analysts (not also to say financial analysts) will have to be delighted to adapt to these new features as the competition between these solutions will continue to be on the rise. In the following blog post, I will give you a personal overview of the state of the market.

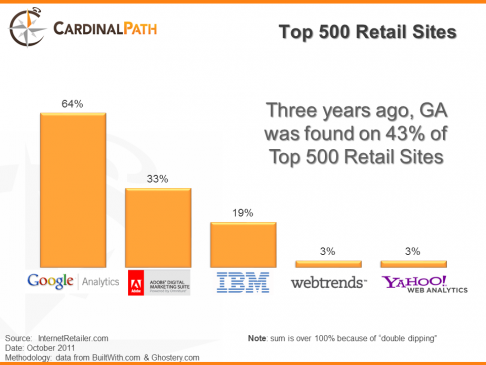
Point 1 – State of the Market: Current Market Shares

In terms of market shares for each web analytics solution, the most recent table I have under the belt dates back from mid-October 2011 by Stephane Hamel. Since that publication, Google Analytics Premium was launched less than a month after, Yahoo Analytics was closed down for Halloween 2012, and I would bet a Benjamin that the top two enterprise solutions (Adobe Omniture and IBM Digital Analytics) have both gained a larger portion of the pie – even though it’s an augmented pie since you can have more than one web analytics solution – when it comes to top 500 North American retailers. According to the graph below, it is quite clear that Google owns a huge chunk of the market, but are they the best positioned to dominate in 2013 in terms of revenues generated? More to come in the next section, surprise, surprise!

web analytics solutions market share 2013
Web Analytics solutions market share 2011

Point 2 – My two cents about each web analytics solution

1. Google with Google Analytics Premium

Google is the only top web analytics solution to have both a free and an enterprise version. While the company may be considered to own the market for web analytics, this is only the case in terms of usage, but not in terms of revenues since Google Analytics is free and Google Analytics Premium is used by only a small amount of companies worldwide. Even though Google owns the free web analytics solutions market, the company is considered as a laggard when it comes to the enterprise web analytics solutions market, the market that generates revenues. Does this mean that the company is topped in terms of market share potential? My rough guess is yes, but this also means that there is plenty of potential to transfer some free clients to an enterprise–level solution, but for this to happen, Google needs to find a way to convince customers of the free version to convert to an enterprise solution that could be considered as good as other enterprise web analytics solutions. For the coming year, I’m expecting a lot from all features related to Universal Analytics that were first announced during the Google Analytics Certified Partner (GACP) Summit held in October 2012 in Mountain View.

2. Adobe with Adobe Analytics

Adobe did a lot for their web analytics solution Adobe Analytics since they acquired Omniture in 2009. To solidify the branding, the web analytics solution even changed name from Adobe SiteCatalyst to Adobe Analytics. With their latest release, a new report called Time Prior to Event was introduced, here is a summary of Ben Gaines upcoming presentation at the Adobe Summit Digital Marketing from March 4th to March 8th 2013 in Salt Lake City.

3. IBM with IBM Digital Analytics

I am a firm believer that IBM has all it takes to eventually become the leader in the web analytics solutions market, necessarily because of how IBM Digital Analytics could be integrated with other IBM solutions. The complete integration between Unica and Coremetrics is still not over, but more and more the IBM Digital Analytics solution – which changed name from the initial IBM Coremetrics name in December 2012 – really looks like it’s making a name for itself. The initial plan in 2010 when IBM realized they bought both Coremetrics and Unica in the same year, was that IBM Coremetrics should be the IBM web analytics solution combining the best features of both Unica and Coremetrics while IBM Unica should be the IBM campaign management solution combining the best campaign management features from Unica and Coremetrics. Furthermore, according to a study by Forrester published in 2011 (note that this link shows only to a single table of the report), IBM Digital was at that time considered as the best web analytics solutions in terms of features. I’m looking forward for the Smarter Commerce Global Summit in Nashville from May 21st to May 23rd 2013.

4. WebTrends
Webtrends was the first true web analytics solution to be launched, dating back in 1995. Even though WebTrends is a great web analytics solutions, it will need sleepless nights for its resellers to keep up with the pressure of the other three giants. Maybe the Engage Webtrends event taking place in San Francisco in less than a week (January 28th to January 30th) will kickstart the year 2013.

Point 3 – Ownership as a Proxy for Potential Revenue Growth for Each Web Analytics Solution

So which company has the highest potential for 2013? Based on the ownership and market capitalization of each company, the answer seems straightforward here. IBM (219.74B) and Google 231.50B) are the two companies with the highest Market Capitalization, Adobe is way much lower at 18.77B but less diluted, and Webtrends looks like a David against Goliaths in terms of Market Capitalization. Even though, WebTrends Market Capitalization is not available since the company is private – my rough guess as of January 20th 2013 is that WebTrends is worth between half a billion and a billion based on how Omniture was sold in 2009.

Top 3 Predictions for 2013

As a conclusion to this post, here are my top 3 predictions for 2013 based on the last 3 points:

1. Google Universal Analytics will change the state-of-the-market finally embracing the Business Intelligence market and leaving the traditional Web Analytics grounds.

2. Adobe and IBM will continue to fight as top enterprise solutions players, trying to convert Google Analytics users to web analytics enterprise solutions users before Google Analytics Premium become more competitive.

3. WebTrends will have to be sold to a bigger player to stay in the race, either Google or Microsoft may be buyers.

Conclusion

As it is looking right now, in this Chinese year of the snake, the web analytics solution market will not be for snake charmers but more for bloody fight involving pythons and boas. Something is sure, whatever the web analytics solution used, what is most important is not the web analytics solution, it’s the web analyst using the solution :-),

Have a great year 2013 everyone,

Jean-Francois Belisle

Enter your email address below to subscribe to this blog

Delivered by FeedBurner

The 10 Most Hi-Tech Cities in the World

When asked the question “which are the top 10 hi-tech cities in the world?”, even the most “tech savvy” candidates tend to have a hard time comparing and/or imagining what is happening on the other side of the globe. In this way, the question is worth asking, and frankly, is far from easy to answer. When searching on the web, most of rankings found in Shakespeare’s language, such as the Popsci or the Wired rankings, tend to focus exclusively on American cities. Personally, the ranking I found the most interesting was one published on the website of The Age, a mainstream newspaper from Melbourne, Australia. Based on six criteria (1. Broadband speed, cost and availability; 2. Wireless internet access; 3. Technology adoption; 4. Government support for technology; 5. Education and technology culture; 6. Future potential), here is their conclusion:

1. Seoul, South Korea;
2. Singapore, Singapore;
3. Tokyo, Japan;
4. Hong Kong, China;
5. Stockholm, Sweden;
6. San Francisco (and Silicon Valley), USA;
7. Tallinn, Estonia;
8. New York, USA;
9. Beijing, China;
10. New Songdo City, South Korea.

The presence of four cities (Seoul, Singapore, Hong Kong, New Songdo City) from the Four Asian Tigers is not surprising. However, the presence of cities like Stockholm (Sweden), Tallinn (Estonia) and New Songdo City (South Korea) is certainly something that yields the most expressions such as: “oh”, “ah”, “what’s that”, “are you kiddin’?”, “really?”.

The presence of Stockholm makes sense when looking at rankings that classify the city as the one with the fastest broadband speed in the OECD countries. Moreover, Stockholm is acting as a pioneer in the use of green technologies such as RFID technologies, and paired with the high number of engineers due in part to the presence of Ericsson, those could be factors that contribute in making this city’s ranking first among cities outside Asia.

The city of Tallinn, mostly unknown to North Americans, except for those who have learned the world’s capitals after the fall of the USSR, is known as the Silicon Valley of the Baltic Sea. The city is also known as being the first to organize an election vote on the internet using smartcards, as well as for its free wireless internet facilities across the city. Tallinn is also recognized for the well-known start-up Skype.

Finally, New Songdo City, situated 60 kilometers East from Seoul, is certainly the most fascinating city in this ranking. The city was built from scratch by Gale International, a real estate development and investment firm, and is considered by technology experts as the ultimate digital city of the future. Even if the city is still upon completion, it is already considered in the top 10 of the most hi-tech cities in the world.

New Songdo City - A New Worldwide High-Tech City Built from Scratch

I can briefly conclude this post by noting that it is nothing new for North America to be limping way behind Asian countries in terms of hi-tech development, and this ranking is only a glimpse of what’s coming next in technology development….

Jean-Francois Belisle

Enter your email address below to subscribe to this blog

Delivered by FeedBurner

What is Big Data? From Bytes to Petabytes

This post is the first of a series of posts related to Big Data, since I thought it was worth going in-depth with this topic. Big Data is a big word, a big buzzword, some might even call it big bullshit, since many components revolving around Big Data, and especially the ones on the analytics/methodology side, that we can label Big Data Analytics, have been around since more than a decade.

Monday June 18th 2012, I went to the Big Data Montreal event #5 as it is written on my Foursquare feed (yes, I used it sometimes!). The event involved presentations mainly on programming and on what where the best software frameworks to use to correctly tabulate all of these data. The conversation was about software frameworks such as Apache Hadoop, Pig, HiveQL and Ejjaberd, all software frameworks I’ve never programmed with, and that have for objective of cleaning the mess in unstructured data. Personally, this is a part of Big Data I’m less familiar with, and what I’m better at is what follows these steps in the process, “Big Data Analytics”. But what is really Big Data?

As defined in “Big Data: The next frontier for innovation, competition, and productivity”, a 143-page report that will become a classic report, the well-respected consulting firm McKinsey suggests that “Big Data refers to datasets whose size is beyond the ability of typical database software tools to capture, store, manage, and analyze” (p.1). So what does this mean? It means that Big Data is only a term that refers to a big dataset, and what revolves around this database are only supporting concepts to Big Data.

Why Should We Care About Big Data?

Yes, Big Data are everywhere, similarly to cheesy teenager’s pop bands that all sounds the same. But do you remember the sentence: “You can’t manage what you can’t measure” by management Professor Peter Drucker? If you don’t, then you should from now on. However, in this Big Data era, the competitive advantage should emerge from the following sentence: “you can manage what you can measure with the right method and the right software”. A little longer and less sexy than the one by Drucker, but at least it is a great follow-up.

Big Data
Big Data are Everywhere

Theorizing vs Observing?

Is Big Data killing science? Is it killing theory? Psychologists create and develop theories by testing on small sample sizes. Big Data analysis is based on the model of Physics which suggests that a different pattern may emerge from any Big Data, which means that there is no point of having a new theory, what we care about is the pattern that is specific to a particular case. In 2008, in a provocative article entitled “The End of Theory”, Chris Anderson, Wired editor-in-chief, made a statement about how Big Data are becoming more and more important in many fields of study. Related to this point of view, I completely agree even though Chris Anderson might be biased since he’s a physicist by training. In anyways, I think that a pattern that emerges from Big Data might be explained by a theory or a series of theories, which would reconcile both points of views.

Conclusion

Big Data may sound simply like a buzzword for many of us. However, even if many of the components that revolve around the concept have been around since many years, as previously mentioned, I agree that the software and programming software used for big data extraction are way much newer than the analytics methods associated with Big Data. It’s so hot at home, I’ll enjoy a big glass of water and prepare for big work tomorrow. I raise my big glass to Big Data!

Cheer up!

Jean-Francois

Enter your email address below to subscribe to this blog

Delivered by FeedBurner

Retailer – Real Basket Value in Retailing

Extreme couponing is not only one of these weird shows on TLC, it’s also more and more a way of living for many households. Since January is generally one of the months where households spend less and are looking to save money in opposition to the bloody months of November and December, I thought it was a timely moment to write a post related to this topic. This post takes a mom blogger approach blended with some of my old-style economist thinking to decorticate the “Real Basket Value” equation and suggests that some extreme couponing behaviors may increase the “Real Basket Value” instead of decreasing it. This post is written purely from a customer perspective rather than from a retailer perspective. So let’s get it started by presenting the “Real Basket Value” equation related to a specific transaction at a retailer:

Basket Price + Direct Costs + Externalities = Real Basket Value

Basket Value - It's Not Only What's in the Basket When Shopping at a Retailer
Real Basket Value - It's Not Only What's in the Basket When Shopping at a Retailer

Basket Price

Let’s first start with the easiest part of the equation, the Basket Price. The Basket Price is defined as the nominal price of all items included in the basket you will buy at a retailer. This is the price you happily or unhappily see on your bill.

Direct Costs

Direct costs may be restricted to distance costs, which can be defined as the additional costs related to the act of moving from point A (Generally your home or your workplace) to point B (the retailer where you will buy your items). These distance costs may include the amount for gas you will spend to make the distance and the depreciation cost of your car related to this particular ride. In some cases you may fix these costs at 0, while in other cases, they may be not as negligible.

Externalities

Externalities are forgotten by many households since they may look frivolous, but the reality is that they may, and sometimes should, have an impact on the “Real Basket Value” equation and
on the final decision of: (1) where to shop/buy, (2) what to buy and (3) in how much quantities? An externality is defined as a cost or benefit that is not transmitted through direct prices.

Most importantly, externalities include time costs. As Benjamin Franklin stated, “time is money”, since time is a scarcity that can be associated to a particular opportunity cost. Some components of “Time costs” are a function of distance costs while some others are not. For instance, the time spent in traffic to reach a retailer is a function of the distance cost while the time spent searching for THE discount is not.

Furthermore, many other costs and benefits could/should also be taken into account. These include: (1) the benefits associated to the loyalty programs points you are gaining in buying what you are buying, (2) the stockpiling costs, (3) the costs or benefits associated to how much life expectancy (including medical costs) you are gaining or losing buying high or low quality food, and (4) the costs or benefits associated to your joy of buying (and most importantly thereafter consuming) a certain type of product that is offered at a particular retailer.

More About the “Real Basket Value” Equation

To fully take advantage of this humble equation, you can do a quick benchmark between two or more retailers or run the equation again by manipulating components of this equation. Thereafter, using heuristics (habits or shortcuts) may be the optimal way to reduce the “real basket value” by cutting useless overthinking.

Conclusion

Happy new year to everyone, enjoy the year 2012 shopping efficiently and don’t spend too much time finding THE “right” coupon since “time is money”.

Cheers,

Jean-Francois

Enter your email address below to subscribe to this blog

Delivered by FeedBurner

An Overview of QR Codes: From Web Analytics Tracking to Advertising to Grandma

During the last year, QR codes have popped up from everywhere around me as well as in most marketing circles in North America. However, for many people, QR codes still remain a mystery. This post is a humble attempt to decorticate what QR codes really are, both from a customer’s and an advertiser’s perspective.

A Quick Overview

QR code is an abbreviation for “Quick Response code” intended to allow its content to be decoded at high speed. It was created by Toyota’s subsidiary Denso Wave in 1994, a company that still owns the patent rights but has chosen not to exercise them. The main objective of Denso Wave was to make “code read easily for the reader” (it looks like a bad Japanese translation, but anyway).

More precisely, QR codes refer to a specific two-dimensional matrix-type barcode, readable by QR barcode readers available on most new smartphones models. It consists of black modules arranged in a squared matrix on a white background. The information encoded can be text, URL or other data. Recently, what has mostly emerged in the online marketing community is the used of QR codes for encoding long URLs for offline advertising.

QR Codes Capacity

Similarly to barcodes, QR codes have extremely high data capacity. There actually exist 40 versions of QR codes (see the Denso Wave website for all versions). Each version has a specific “module configuration”, where the module refers to the black and white dots that make up QR codes. Version 1 is a 21 modules by 21 modules square, while version 40 is a 177 modules by 177 modules square. Each higher version number includes four additional modules per side, which suggests that version 41 would be 181 modules by 181 modules. Version 40, when error correction “L” is used (read more on error correction for QR codes), can encode up to 4,296 numeric symbols or 7,089 alphanumeric symbols.

How to Read QR codes?

There exists multiple mobile applications to read QR codes, one can use the QR code scanner integrated in Google Goggles available for the iPhone, and the Android platforms. For iPhone users like me, the Bakodo application is currently the most used (for the iPhone version I have) since it permits to read both barcodes and QR codes.

Who Uses QR codes?

QR codes usage by consumers is still extremely marginal. If you’re in Asia, especially in Japan or South Korea, where it seems mainstream since some years (2009-2010), it may be different, but in North America, maybe not in San Francisco (I will have the answer no later than this August) it is still reserved to geeks, so it’s still time to be considered as innovators (or geeky consumers) but it may change fast.

QR code for Jean-Francois Belisle website

How to Generate QR Codes?

There exists many ways to generate QR codes for your website URLs or any other kind of data. However, the QR code generator on the Tools I Seek website seems to be the reference to generate fast QR codes for your website URLs.

When Should Advertisers Use QR Codes?

Usage of QR codes has been emerging at a fast pace. You can actually put QR codes on cars and buses if you want or on magnetic cards and dishwasher machines (I don’t see the point but …). However, from an advertising perspective, one needs to take into account at least four factors when deciding to include a QR code or not: (1) the amount of data to be stored, (2) the medium used, (3) the space available for the ad, and (4) how it may alter the ad design.

From a web tracking perspective, QR codes should be used to target any marketing campaign even when the URL is extremely short. However, if you’re tracking a campaign properly using tools to separate sources such as Google link builder, your campaign should always have a long URL anyway. In exceptional cases, if you have a short website URL, you may want not to include QR codes for lack of space and/or not to alter the design. This may be the case for small ads in magazines or TV ads. However, on magazines and especially on billboards, I am a huge advocate of including QR codes. For an A-B-C guide on how to track campaigns, you can follow this Google URL Builder Guide by Prateek Agarwal.

QR codes should be seen as complements to website URLs on an ad, not as substitutes, since you may reach different types of consumers. Anyway, rarely you will encounter a consumer both scanning a QR code and typing a web URL after.

If there is a place where QR codes are useless for encoding URLs, it’s on the web. Which consumer will want to scan a barcode when on the web to get access to a URL using another device? It may happen, but I don’t see the benefits compared to the disadvantages it may bring by altering the design.

Pepsi QR Code Campaign for Pepsi Max

How to Track QR Codes?

Like mobile technology, QR codes are useful for tracking campaigns even though they for sure underestimate the number of consumers who have seen an ad. For more about how to use QR codes for web tracking using Google Analytics, Publicinsite got an excellent post on the issue entitled “QR codes and Google Analytics to track mobile devices”.

Conclusion

QR codes may not be as sexy as social media, but similarly to tiny URLs, they are around to stay. After the emergence of location-based services, they are another technological innovation that pushes in the direction of connecting the offline world to the online ecosystem in a multichannel marketing fashion.

Enjoy your QR code quest with your mobile device,

Jean-Francois Belisle

Enter your email address below to subscribe to this blog

Delivered by FeedBurner

An Introduction to Data Mining for Marketing and Business Intelligence

I spent the last few weeks digging deeper into time series-related methods and data mining methods. For this post, I have decided to write a broad introduction related to the latter (data mining), since it may look more practical and also trendier than time-series (but watch out with the emergence of Particle Filtering and other Sequential Monte Carlo methods (SMC)).

Introduction to Data Mining and Criss Angel

So what is data mining? Data mining can be defined as the process but also the “art” of discovering/mining patterns, meaning and insights in large datasets by using statistical and computational methods. In other words, a data miner is like a Criss Angel (You can pick any other magician here!) that will make appear from your messy ocean of data, insights that will be valuable to your company and may give you a competitive advantage compared to your competitors; simply read Tom Davenport’s bestselling book “Competing on Analytics: The New Science of Winning” if you’re not convinced yet about the power of analytics and by extension of data mining. Furthermore, data mining related tasks are also considered as part of a more general process called Knowledge discovery in databases (KDD) which includes the “art” of collecting the right data as well as organizing and cleaning these data, which are also extremely important tasks prior to analyzing the data.

Some Brief History and a Link to Business Intelligence

Data mining mainly takes its roots from the fields of Statistics and Computer Science (some might say Artificial Intelligence) and may also be referred as “Statistical Learning”. From a statistical perspective, most early and recent advances coming from Statistics have come from the Stanford Statistics department school of thoughts (Leo Breiman (was at UC Berkeley), Bradley Efron, Jerome H. Friedman, Trevor Hastie and Robert Tibshirani). By the way, don’t forget that Stanford University is only 7 miles away from Google. Furthermore, the emerging field of Business Intelligence has blossomed as a combination of: (1) data mining tasks, (2) information systems technology and (3) crispy marketing insights.

Professor Leo Breiman - Considered As The Founder of the field of Data Mining

Types of Data Mining Methods and Marketing

Data mining methods can be divided in multiple ways. However, most books on the topic, and especially those related to marketing and business intelligence, will generally divide data mining methods into two types, the ones related to supervised learning and the ones related to unsupervised learning.

Supervised Learning

Supervised learning is often more associated to scientific research as it includes tasks where the data miner needs to describe or predict the relationship between a set of independent variables (also referred to as inputs, features) and a dependent variable (also referred to as outcome, output or a target variable). Moreover, the dependent variable can be categorical (i.e. churn rate or classes of customers) or continuous (i.e. money earned from that customer) while the independent variables may be of any type but needs to be coded properly (i.e. dividing the categorical variables into separate binary variables). From a marketing and business intelligence perspective, I will divide supervised learning into two interrelated tasks: (1) supervised classification tasks and (2) Predictive Analysis.

Supervised Classification tasks: Supervised classification tasks occurred when you want to predict correctly to which class/category (this is the dependent variable) belong the new observations (i.e. customers) based on results from an already known training dataset. Generally, you will achieve this task by using: (1) a training dataset, (2) a validation dataset and (3) a test dataset. Most known methods I’m using for these tasks are the following:

1. Multinomial Logit (MNL)
2. Linear Discriminant Analysis (LDA)
3. Quadratic Discriminant Analysis (QDA)
4. Flexible Discriminant Analysis with Multivariate Adaptive Regression Splines (FDA – MARS)
5. Penalized Discriminant Analysis (PDA)
6. Mixture Discriminant Analysis (MDA)
7. Naïve Bayes Classifier (NBC)
8. K-Nearest Neighbor (KNN)
9. Support Vector Machines with multiple Kernels (SVM)
10. Classification and Regression Trees (CART)
11. Bagging
12. Boosting
13. Random Forests
14. Neural Networks

Predictive Analysis: I’ve decided to include the expression “Predictive Analysis” here, since it’s a buzzword in the web community nowadays. However, any task related to supervised classification involve a so-called “Predictive Analysis”. However, “Predictive Analysis” is a broader expression that also includes tasks related to the prediction of a continuous dependent variable rather than a categorical variable. Additional methods which can’t be used to conduct classification analyses may be used for predictive analyses with continuous variables and vice-versa.

Unsupervised learning

Unsupervised learning is when the data miner task is to detect patterns based only on independent variables. It is generally presented more from an algorithmic fashion rather than from a purely statistical fashion. Well-known methods applied to marketing includes: (1) Market Basket Analysis and (2) Clustering.

Market Basket Analysis: Market basket analysis (also abbreviated as MBA to confuse you even more) is certainly one of the most known and easier task relating data mining and marketing. It is considered more as a typical marketing application rather than as a data mining method. It can be simplified as a simple Amazon recommendation algorithm showing as an association rule that “the probability that customers who bought item A also bought item B is 56%”. The classic urban legend about Market Basket Analysis is the “beer” and “diapers” association where a large supermarket chain, most people will say Walmart, did a Market Basket Analysis of customers’ buying habits and found an association between beer purchases and diapers purchases. It was theorized that the reason for this was that fathers were stopping off at Walmart to buy diapers for their babies, and since they could no longer go to bars and pubs as often as before, they would buy beer as well. As a result of this finding, the supermarket chain managers have placed the diapers next to the beer in the aisles, resulting in increased sales for both products.

Clustering: The method of Clustering is defined as the assignment of a set of observations (customers) in subsets (clusters) where customers in a cluster are similar to each other while they are different from other customers in other clusters. Clustering is often used in marketing for segmentation tasks. However, even though segmentation may be achieved through “clustering”, more modern supervised methods such as Bayesian Mixture Models, which I must say are not really part of the data mining field, are used by the few practitioners who can actually understand how to program this method (this is one method I am programming these days). For more about segmentation, I would refer anyone to the book “Market Segmentation: Conceptual and Methodological Foundations” by Michel Wedel and Wagner A. Kamakura, both are professors and well-known authorities on the topic.

Some Top References

I must say without a doubt that the best book I know about data mining is surely “Elements of Statistical Learning” by Stanford Professors Trevor Hastie, Robert Tibshirani, and Jerome H. Friedman which covers broadly and nearly every type of methods you can use to conduct data mining tasks. However I must admit that this book has a focus on the statistics behind the methods (but it’s extremely clear) rather than on the software tools (No, it’s not a cookbook) you could use to conduct these analyses, and it may also lack of marketing applications for a marketer. Furthermore, to get some updates about the data mining world, KD Nuggets, administered by Gregory Piatetsky-Shapiro, is actually THE reference for the data mining world.

Some Top Software

Here is a description of some software I would recommend for data mining tasks, feel free to propose your own software in the comments section:

1. R: R is actually my favorite software. I have been using the software for mainly all of my statistics-related tasks for the last 2 years. Its free, open source, it has an extensive and very knowledgeable community, it’s extremely intuitive and it can be learned more easily if you have knowledge of software such as C++, Python and/or GAUSS. Furthermore, there are a lot of useful packages available to facilitate the coding. However, I must say that compared to C++ or SAS, sometimes R can be slow for data mining tasks involving a heavy load of data.

2. rattle: rattle, which stands for the R Analytical Tool To Learn Easily, is a “point and click” data mining interface related to R and developed by Graham Williams of Togaware. Frankly, I must admit that this software rocks even though I generally don’t like “point and click” software. It’s extremely complete and quite easy to use.

3. SAS Enterprise Miner: SAS Enterprise Miner, a module in SAS, was the first software I used for performing data mining tasks. It is extremely fast and user-friendly. However, I must admit that it reminds me software like Amos, now included in PASW (formerly SPSS) for Structural Equation Modeling (SEM) tasks, where you move the “little truck” to build your model and don’t really understand what you’re doing at the end of the day. Furthermore, it costs a lot but to my knowledge, SAS is the only software platform integrating data mining tasks with web analytics and social media analytics.

4. RapidMiner: RapidMiner formerly known as YALE (Yet Another Learning Environment) is considered by multiple data miner as THE software to use to conduct data mining tasks. Similarly to R, the software is open source as well as free of charge for the “Community” version. I haven’t made the switch from R to RapidMiner yet and I am currently testing the software in depth.

5. Salford Systems: I must confess that I never used Salford Systems software but know them by reputation, thus, I can’t have a clear personal opinion on the software. However, statisticians working at Salford Systems are presenting workshops on data mining for the next Joint Statistical Meeting (JSM) in Miami at the end of July 2011 which I might attend.

rattle - Software for Data Mining and Business Intelligence

Waiting time and Conclusion

Whatever the software you’re using, data mining-related tasks will always be demanding in terms of your computer memory. Data Mining in marketing and business intelligence and more broadly KDD is an art that requires strong statistical skills but also a great comprehension of marketing problems. So when you’re waiting for your data mining computations, feel free to come by and read my other cool posts on your other computer! In anyways, enjoy data mining and as one of my friend would say “show some respect to the machine”, but even more to the data miner!

Cheers,

Jean-Francois Belisle

Enter your email address below to subscribe to this blog

Delivered by FeedBurner

My Top 10 Super Bowl Commercials for 2011

I know the Super Bowl XLV is over since more than a full week and most of you must have been thinking in the last few days about the Valentine’s day or the Arcade Fire Grammy Award instead! I spent the last week grading some MBA projects so I was on a grading/rating mode and this is why I decided that selecting and rating the best Super Bowl commercials of 2011 could be a great idea for a post. So let’s get back to February 6th 2011, the day I was one of the lucky Canadians to be exposed to Super Bowl local commercials, which means that instead of watching the super commercials, I had the opportunity to see commercials from the FTQ, TD Bank and BMO, which were correct, as well as the ultra-silly CTV commercials on FOX of programs such as Flashpoint and The Listener. As listed by Adage, there have been 53 different commercials during the Superbowl XLV.

Super Bowl XLV Logo
Super Bowl XLV Logo

After having watched each of these 53 commercials, even the Groupon advertising related to Tibet, my top 10 of these commercials is based on ratings related to four components: (1) buzz potential, (2) originality, (3) brand awareness pumper, and (4) call-to-action; the first two components being related more to the emotional appeal while the last two are more related to rational appeal. Here are the definitions associated to each of the four components, as well as an “overall” component.

“Buzz potential” (BUZ) – Potential of the commercial to be shared across the Internet.
“Originality” (ORI) – Broadly answering how original is this commercial?
“Brand Awareness Pumper” (BAP) – How much it makes you “additionally” aware of the product?
“Call-to-action” (CTA) – How it influences you to know more about the product or to buy it?
“Overall” (OVR) – Summation of the four components score on 40.

So here is my top 10 from 10 to 1 as well as my ratings and my 2 cents about each of these commercials. Enjoy!

10 – BMW – Defying Logic

Length: 30 seconds

BUZ – 5
ORI – 5
BAP – 10
CTA – 9
OVR – 29

My 2 cents: One of many Super Bowl commercials related to the car industry. It is a great commercial in terms of the rational appeal with a solid call-to-action. However, it has relatively low potential for buzz. Furthermore, the main storyline is brilliant, especially to counter-attack the reviving American pride movement in the car industry.

9 – Cars.com – Go First

Length: 30 seconds

BUZ – 9
ORI – 7
BAP – 6
CTA – 8
OVR – 30

My 2 cents: A funny video with important buzz upside. However, even though the call-to-action is well-presented at the end, the product advertised is only identifiable at the end.

8 – Career Builder – Parking Lot

Length: 30 seconds

BUZ – 7
ORI – 8
BAP – 7
CTA – 8
OVR – 30

My 2 cents: As a follow-up to last year commercial, Career Builder proposed a great metaphor, “being stuck in a dead-end in an organization”. The metaphor is well-implemented, but maybe too much second degree for some customers drinking beer during the Super Bowl.

7 – Bud Light – Hack Job

Length: 30 seconds

BUZ – 8
ORI – 8
BAP – 7
CTA – 9
OVR – 32

My 2 cents: My favorite Budweiser-related commercial. It is a great parody of the house makeover shows accompanied by a great call-to-action to the Bud Light product.

6 – Pepsi Max – Love Hurts

Length: 30 seconds

BUZ – 9
ORI – 8
BAP – 8
CTA – 8
OVR – 33

My 2 cents: The best Pepsi Max commercial of the Super Bowl, it is childish and reminds me of The Simpson’s Ball in the nuts episode but it works well.

5 – Bridgestone – Carma

Length: 30 seconds

BUZ – 7
ORI – 8
BAP – 9
CTA – 9
OVR – 33

My 2 cents: A simple but intelligent commercial, targeted mainly to women or boys who like sweet animals.

4 – Chevy – Status

Length: 30 seconds

BUZ – 9
ORI – 6
BAP – 10
CTA – 8
OVR – 33

My 2 cents: Sweet mix of romance and technology related to Facebook news update. Plugging a new Chevy feature in a cheesy story near Valentine’s day, what a shot!

3 – Chrysler – Born of Fire

Length: 120 seconds

BUZ – 6
ORI – 9
BAP – 10
CTA – 10
OVR – 35

My 2 cents: The longest commercial of the Super Bowl but also one of the clearest in terms of the message. The portray of both Detroit and the Chrysler 200 build with hard work and local pride embellished with the tagline “Imported from Detroit” is a slap in the face to the BMW commercial as seen on position #10.

2 – Volkswagen – The Force

Length: 60 seconds

BUZ – 10
ORI – 8
BAP – 9
CTA – 9
OVR – 36

My 2 cents: Voted by many as the best commercial of the Super Bowl, both simple and original at the same time.

1 – Motorola – Empower the People

Length: 60 seconds

BUZ – 8
ORI – 8
BAP – 10
CTA – 10
OVR – 36

My 2 cents: Based on George Orwell book entitled “1984” metaphor, this commercial is both a critique of Apple, as well as a “grand coup” to advertise the highly-anticipated Motorola Xoom tablet.

Conclusion

In conclusion, the Super Bowl XLV hasn’t been a great year in terms of Superbowl commercials, but each of these top 10 commercials has a least a “little something” to either make you smile or to make you think about your customer consideration set. So which one of these Super Bowl XLV commercials is your favorite? And why? Hope you enjoyed it!

Have fun!

Jean-Francois Belisle

Enter your email address below to subscribe to this blog

Delivered by FeedBurner

Budweiser Super Bowl Commercials and Bad Drivers

About 10 days ago, it was Saturday January 22nd (generally you remember those dates), my girlfriend and I were driving en route for a beautiful snowshoe trip. Few minutes before arriving to our destination, a driver completely burned a red light at an intersection and drove right into the front left wheel of my girlfriend’s car. The result was a 70-kilometers-difference accident. Few moments later, the car was wrecked, but most importantly we were miraculously OK, surrounded by Police officers, Firefighters and the emergency ambulance squad. I didn’t took pictures of the accident, I was too occupied living the moment and tried to help everyone implied in the accident, even the other driver who ran into us. Was this guy on alcohol (supposedly no!), was he on drugs/medication (it mainly looks like, since he first refused to go to Hospital after the accident, but I couldn’t confirm). Hours later, I was getting back to normal, and like in the cult movie The Big Lebowski, I simply wanted to yell at the other driver the F-word. Is that reaction noble-minded? No! Should it be? You decide!

Budweiser Ads during Super Bowl

So what is the link of my car accident with Budweiser Super Bowl Ads? Not a lot, except that it creates a awkward contrast and that Super Bowl XLV is this Sunday February 6th 2011 and I need to be alive to enjoy these commercials and continue blogging. Moreover, I don’t understand why from a ROI perspective Amheuser-Busch, the company behind Budweiser, should buy five spots during the Super Bowl (three 30-second Bud Light spots; a 60-second Bud spot and a 60-second ad for its import, Stella Artois, for more on the topic, you can read this USA Today article on Super Bowl ads, and see a “sneak” of the Budweiser Super Bowl XLV 2011 ads below)? Here is my take in three points explaining why 5 spots are too much and why 2 or 3 spots may be more optimal!

1. Awareness is already topped

Most people watching Super Bowl associate the event with Budweiser ads anyway! One ad for the Stella Artois and one for the Bud Light lime or a more girlish beer would be enough, especially if there is a link to the Budweiser website at the end of the ad, where other cool ads not shown during Super Bowl can be found. Also, it would create more scarcity and make these ads even more special.

Furthermore, awareness for the Budweiser classic beer is already topped for most people, if you like it, you consumer it, if you hate it, you don’t consume it, but most importantly, you already know it. Personally, I always enjoy these ads, but last time I tasted a Budweiser beer, my reaction was that it tasted like “s**t”, and I guess I’m not the only one. On the other side, awareness for the Stella Artois and the Bud Light lime could still be improved, this is why I would keep these spots.

2. Buzz can be easily generated

Completely abandoning Super Bowl ads for Budweiser may not be the best idea, however, at the end of each spot, referring people to the Budweiser website would be a great idea. The buzz would be easier to create than for any other ad seen on TV this year.

The Budweiser horses are back this year for Superbowl XLV

3. Putting money elsewhere – Diversification maybe the solution

Saving money from a 3 million dollars 30-second spot may leave money for other activities. Diversification in packaging, diversification in flavors, even though the classic Budweiser is a best seller, it’s a topped bestseller. Investing more money in R&D and diversification would be a better idea than on these ads. For more on successful product diversification, I propose to enjoy the classic TED presentation (see video below) of Malcolm Gladwell discussing the Howard R. Moskowitz diversification strategies in the food industry with a special focus on spaghetti sauce.

Conclusion

Some might say the savings in millions of my humble propositions are nothing for a company like Anheuser Busch? My argument on this one, is that any money saved and better invested is great for the company. In conclusion, Budweiser Super Bowl ads are always nice to watch anyway. A great beer is still part of a great party. However, responsibility is also part of a great party. To relate to my first portion of this post, don’t drive if you drink too much, enjoy life and enjoy the Super Bowl XLV!

Cheers,

Jean-Francois Belisle

Enter your email address below to subscribe to this blog

Delivered by FeedBurner

The World of Marketing is Changing – Three Types of Interconnected Marketing Revolutions

The right-wing is growing in popularity in the United States, Ben Ali is finally kicked out of Tunisia. Greece, Ireland, Portugal and Iceland are leaning toward bankruptcy, Fidel Castro will die soon, Duvalier is back in Haiti, and India and China are continuing to embrace capitalism. It smells change! It smells revolution! But what about business and more precisely marketing? What does it smell? I would say it smells the roast of a revolution too! But what kind of revolution? I would say three types of interconnected marketing revolutions: (1) the retailing experience revolution, (2) the automated personalization revolution and (3) the social media revolution.

Revolution #1 –The Retailing Experience Revolution

Let’s first start with the retailing experience revolution, since it’s the oldest and the more marketing-related revolution. In the 90’s, companies started to become aware of the importance of store design and atmospherics and how it could enhance a consumer’s experience and thereafter leverage sales. Companies started to become aware of the power of (1) music style, (2) music tempo, (3) decors, (4) store colors arrangement and more importantly, (5) the power of building the right brand-related ambiance. All these techniques have culminated with the bestselling book “Why We Buy? – The Science of Shopping” by Paco Underhill that brought “ambiance research” to another level. An interesting update and complement published in 2010, is “Buy-ology” by the danish author Martin Lindstrom with a foreword by Paco Underhill.

Thus, running into a mall is no longer a boring utilitarian task for many of us (but it is still for some guys!), it’s more than ever an “Experience” (with a capital “E”), and the cheapest experience you can buy, the only thing it costs is gas or any transportation fees, and that … until you buy. Some companies have even brought the experience one step further, simply taking a look at the Charmin’ restrooms in New York City and the Apple Genius Bar will make you understand that it’s all about “Experience”.

The Apple Genius Bar - A great example of The Retailing Experience Revolution
The Apple Genius Bar – A great example of The Retailing Experience Revolution

Pushing the peanut one step further, the importance of a fit between a website design and its associated brand is another example of this retailing experience revolution. Thus, the creative part of ergonomics is totally inlaid in this revolution.

Revolution #2 – The Automated Personalization Revolution

If petroleum was the “Black Gold”, the water the “Blue Gold”, then the web can be defined as a golden mine of information. But it is more and more a golden mine of information for companies to find you and then target you. More and more companies know who you are, where you are, and what you want? It looks more and more like a “Big Brother” issue, to quote one of my favorite authors George Orwell. In web terminology, it could be referred to as Web 3.0 – the information finds you and meets your needs before you find it.

From Online to Offline to On-line

The beginning of this revolution started with Amazon in 1994, the objective was to target the consumer/user based on collaborative filtering. Most importantly, the automated personalization is a real-time updating (on-line) process that collects information about you and adapts its offering as you evolve in the society always relying on people similar to you. Amazon CEO, Jeff Bezos, is a graduate in Computer Science and Electrical Engineering from Princeton. Since then, tons of computer scientists and statisticians with expertise in computer programming and data mining/statistical learning emerged in start-ups or changed the business culture of already existing companies.

More and more, this personalization revolution will appear offline. With the advent of location-based services like Foursquare and Gowalla, this is simply the icing on the cake. Companies can now bring your offline information online and then target you. This is marvelous for the consumer but in the long-run it would be even more interesting for the company. Offline examples include the possibility to learn about consumers using intelligent in-store displays (see my post entitled “The In-Store Displays are Watching You” on the topic), then merging the retailing experience revolution with the automated personalization revolution.

Revolution #3 – The Social Media Revolution

Let’s first put something clear. As in the ancient time, people are still communicating, they are simply communicating using different platforms. In this way, there was social life before social media, as there was statistics and KPIs before web analytics, as there was information available before the Internet. Traditional way to communicate to others should always be taken in consideration by any company and ad agency. However, what should also be taken in consideration is that what is said on the web, stays on the web. In the 1950’s at Tupperware parties, people could say what they want, and what was said, could be forgotten the other day or burned in the fireplace, but now it stays and sticks on the web as an unwanted Facebook picture. Thus, the traditional ways of communication stay, but the media changes and the information is carved in stone. Here are my top 9 changes related to social media (feel free to suggest me some others):

1. People are less patient than before, they want it right now;
2. People are more connected, but they know less about their connections than before;
3. People communicate more with strangers online, but less with strangers offline;
4. People trust less traditional advertising than before and more their weak ties than their strong ties;
5. People have less privacy than before;
6. People who have nothing important to say are gaining supporters compared to experts;
7. People are spending less time on television and more time on the Internet;
8. The information is spreading faster;
9. The information is more tractable.

The Social Media Landscape by Fred Cavazza - A "Must" at Every Update
The Social Media Landscape by Fred Cavazza – A “Must” at Every Update


But why is social media a marketing or more globally a business revolution? Since the information is easily tractable on the web, what is most useful from a business perspective is the possibility to broadly answer the 5W’s for almost any brand:

1. Who is writing about your brand?
2. What is written about your brand?
3. Where are consumers writing about your brand?
4. When are consumers writing about your brand?
5. Why are consumers writing about your brand?

Nowadays, using social media monitoring platforms like Radian6, Sysomos, Lithium (Scout Labs), etc… to answer these 5 questions is more and more common for firms or agencies. Consulting agencies using their own powerful solutions such as Nexalogy have also emerged in the business world. More and more, the social media revolution is tending toward the automated personalization revolution.

The power to the morons? – From Plato to Ashton Kutcher

In the 4th century BC, Plato dreamed about what he referred to as “The State”, where experts could lead and share their decisions. If Plato would be alive today, he would certainly kill himself. Social media platforms sure give more power, the problem is that sometimes, it reinforces power to people that sometimes simply have nothing intelligent to say. Following Ashton Kutcher on Twitter may be funny, but most of what he is saying is useless. However, he is certainly one of the most influential individual on Twitter. Overall, there is surely more information exchanged than before on the social media platforms, but there is also extremely high number of “babbles”. Getting rid of “babbles” is one of the main challenges of any social media monitoring platform.

Conclusion

In conclusion, whatever is the revolution that is affecting your job the most, what is most important to keep in mind is that there was life before these revolutions. What you’ve learned in your “Introductory” marketing courses 10 years ago is not good for trash, it is still relevant, but it simply needs to be updated, to be integrated with concepts related to these revolutions. However, what mainly differs from political revolutions is that we can’t escape from these revolutions, we are all voluntarily or involuntarily part of these revolution. Any other ideas of revolutions? Want to play Risk© against me and start you own revolution?

Enjoy these revolutions you little “Che”,

Jean-Francois Belisle


Enter your email address below to subscribe to this blog

Delivered by FeedBurner

Worldwide Internet Penetration Rate Part 3

2011 is officially started and I am back from my Holidays vacations as fresh as the Social Network movie on Rotten Tomatoes (97% of freshness while this post was published). Similarly to last year, I have decided to start the year with an update on the world Top 30 countries with the highest Internet penetration rate for nations with more than a million individuals. Since I like numbers and political geography, here is the new Top 30 using data from The Internet World Stats database compared to the two previous ones of respectively April 2009 (see Canada in the Worldwide Top 3 for Internet Penetration Rate) and January 2010 (see Worlwide Top 30 for Internet Penetration Rate in 2010).

Jan. 2011 Jan. 2010 April 2009 Jan. 2011 Jan. 2010 April 2009
Countries Position Position Position Rate Rate Rate
Norway 1 1 2 94.8% 90.9% 87.7%
Sweden 2 2 6 92.5% 89.2% 77.4%
Netherlands 3 3 1 88.6% 85.6% 90.1%
Denmark 4 4 14 86.1% 84.2% 68.6%
New Zealand 5 7 4 85.4% 79.7% 80.5%
Finland 6 5 15 85.3% 83.5% 68.6%
United Kingdom 7 9 16 82.5% 76.4% 68.6%
South Korea 8 8 11 81.1% 77.3% 70.7%
Australia 9 6 5 80.1% 80.1% 79.4%
Germany 10 23 19 79.1% 65.9% 63.8%
Japan 11 10 7 78.2% 75.5% 73.8%
Belgium 12 18 77.8% 70.0%
Singapore 13 15 25 77.8% 72.4% 58.6%
Canada 14 12 3 77.7% 74.9% 84.3%
United States 15 13 10 77.3% 74.1% 72.3%
United Arab Emirates 16 29 75.9% 60.9%
Switzerland 17 11 13 75.3% 75.5% 69.0%
Estonia 18 21 23 75.1% 68.3% 58.7%
Austria 19 16 27 74.8% 72.3% 56.7%
Slovakia 20 26 74.3% 65.3%
Israel 21 14 9 71.6% 72.8% 72.8%
Taiwan 22 24 17 70.1% 65.9% 67.2%
France 23 19 26 68.9% 69.3% 58.1%
Hong Kong 24 20 12 68.8% 69.2% 69.5%
Latvia 25 28 67.8% 61.4%
Ireland 26 22 65.8% 67.3%
Czech Republic 27 65.5%
Malaysia 29 25 24 64.6% 65.7% 59.0%
Slovenia 29 27 18 64.8% 64.8% 64.8%
Spain 30 17 20 62.6% 71.8% 63.3%
Hungary 30 61.8% 59.3%

What has changed?

As stated in my previous post last year, changes in the ranking are mainly due to two factors: (1) changes in the sources used by The Internet Worlwide Stats Database, and (2) natural growth. Since last year, not that much has changed, 9 of the countries in the Top 10 are still present and 29 of the Top 30 are still dominating this ranking. The only newcomer is Czech Republic in position 27. Scandinavia and Oceania are still leaders in terms of Internet Penetration rate while Germany and United Arab Emirates are the winners of this ranking, each gaining a whopping 13 positions. This change for Germany should be related to a change in the source which was underestimating the penetration rate. Furthermore, despite all the financial concerns raised during last recession related to the viability of all luxury hotels, villas and islands in Abu Dhabi, I would tend to think that most of the increase for the United Arab Emirates is linked to technological growth rather than a change in sources.

Furthermore, I would also add some doubts about the strange downward variation for Spain that should certainly be related to a change in source too.

Logic and statistical interpretation 101

When looking at this ranking, it is important to understand that all countries have different ways of measuring the Internet Penetration Rate, but globally unless there are bombing destroying a country similarly to Japan in World War II, there should not be more than a 2% downward variation, a variation that could be related to statistical noise. Even for growth, more than 10% for a year is generally associated to a change in the source used, especially for European countries, since absolute and relative growth is mainly seen for BRIC (Brazil, Russia, India, China) countries. Thus, even though these countries have low Internet Penetration Rates, they account for nearly one-third (32.36%) of the world Internet users population, China alone accounting for more than one-fifth (21.35%). Here is below a table representing the Internet Penetration Rate of these four countries but also the percentage of users in comparison to the world total.

Jan. 2011 Jan. 2011
Countries Rate % World
Brazil 37.8% 3.86%
Russia 42.8% 3.03%
India 6.9% 4.12%
China 31.6% 21.35%

BRIC countries: Brazil, Russia, India and China

Conclusion

In conclusion, there is not that much new concerning the Worldwide Top 30 countries for Internet Penetration Rate. However, what will be more and more interesting to look at in the future is the growth of the BRIC countries. Furthermore, I know it’s only the beginning of the year, but if you’re looking for a techno-trendy country or city to visit, this ranking is a good complement to my post entitled The 10 Most Hi-Tech Cities in the World, but also to the lucky 13 cities in the world described in my post entitled The art of Being Perceived as an Innovative Mind in Marketing.

Happy new year to everyone!

Jean-Francois

Enter your email address below to subscribe to this blog

Delivered by FeedBurner